|
|
|
You can get e-magazine links on WhatsApp. Click here
|
|
|
|
|
|
Salt content in most Indian packaged foods not upto global standards: Study
|
|
Friday, 15 July, 2016, 08 : 00 AM [IST]
|
|
Ashwani Maindola, New Delhi
|
|
fiogf49gjkf0d fiogf49gjkf0d High levels of salt in packaged foods sold in India is posing a serious threat to health of people, according to a recent research by the George Institute for Global Health, Public Health Foundation of India and the Centre for Chronic Disease Control, India. Salt intake in India is estimated to be more than double the recommended maximum of 2000mg sodium (5g salt) /day set by World Health Organisation.
The study, which looked at 5,796 packaged food products, revealed huge differences in the salt content of similar foods, with some containing almost 10 times more salt than others. In fact, with regard to compliance to global level standards, less than a quarter of the products surveyed would meet UK 2017 salt targets, informed the institute in a statement.
Elaborating on the study, Dr Vivekanand Jha, executive director, The George Institute for Global Health, India, stated, “The high level of salt in processed food is a great public health concern, as we are noticing a shift in dietary habits towards more convenience foods. The main problem caused by salt is high blood pressure which greatly increases the risk of stroke, heart attack and kidney failure. These are all now leading causes of death and disability in India.”
The research looked at nine main food categories which contribute salt to the diet in India, and revealed that many food groups contain excessively high levels of salt. In particular, cooking sauces, table sauces and spreads contained on average five-and-a-half gram of salt per 100 gm, with some containing 10 times that amount and others with almost no salt at all. “This is particularly alarming as sauces and spread are often added to meals, and with such high salt contents, it will add substantially more salt to the diet,” said Dr Jha.
Similarly, papads, a popular meal accompaniment, contained as much as 5gm salt/100gm, whilst others contained no salt. “These findings clearly illustrate that food manufacturers are able to produce these foods with much less salt,” pointed out Clare Farrand, senior project manager for salt reduction strategies, WHO Collaborating Centre for Salt Reduction at The George Institute for Global Health, Sydney.
“In view of this report and the change in dietary habits, there is an urgent need for the Government of India to develop a clear set of criteria or targets to reduce the amount of salt added to food by the food industry. This research provides baseline data on the amount of salt in foods sold in India, which can be used to develop reformulation targets to reduce salt levels in food as part of a national salt reduction strategy and reduce the risk of stroke and heart disease related disease death in India,” she added.
The World Health Organization (WHO) recommends all member states reduce mean population level salt intake by 30% by 2025. The WHO Collaborating Centre on population salt reduction at The George Institute for Global Health, Sydney, has a remit to support countries to achieve these targets.
Further to this, the survey revealed that only a third of products had salt content on the nutrition label, making it impossible for Indians to know how much salt they would be eating, and make a healthier choice. Almost a quarter of products carried no nutritional details at all.
“We think it’s important that Indian consumers can easily see what’s in their food; there is a clear need for better food labelling,” said Dr Prabhakaran from the Public Health Foundation of India and Centre for Chronic Disease Control, New Delhi. He noted, “It currently isn’t mandatory to display salt levels on food packaging but it’s certainly something we need to consider.”
The institute added that to help Indians make healthier packaged food choices and stay healthy, it has launched ‘FoodSwitch’ – an innovative nutrition mobile app. Users can download the app for free from the iTunes store or Google Play and use it to scan the barcode of any packaged food product.
The app will display a colour coded label coloured green (good), amber or red (limit) depending upon the amount of salt in the product. It will show the same colour coding for fats and sugars and list similar but healthier alternatives, making it easier than ever before to make a better choice.
Key findings
(24%) of products do not have any nutrition information, and therefore do not meet the Food Safety and Standards Authority of India (FSSAI) national nutrition labelling requirements for processed foods (2011).
Two thirds of products do not list salt on the nutrition information panel and do not meet International Codex Alimentarius requirements.
Some products contain excessively high levels of salt; for example papads, a commonly consumed meal accompaniment in India have a mean sodium content of 1219mg/100gm – with a range of 2-4000mg/100gm. This illustrates that papads can be made with as little as 2mg of sodium/100gm, 2000 times less sodium than the papad product with the highest sodium content.
Less than a quarter of products meet the UK 2017 salt target, emphasising the need for a clear strategy to reduce the amount of salt added to processed foods.
Implications
Incomplete nutrition information makes it impossible for people to know what they are eating and hard to make a healthier choice.
Absent nutrition information makes it difficult to monitor amounts of salt, fat and sugar in widely consumed food products, and hold the food industry to account to reduce the unnecessary amounts of salt, fat and sugar added to processed foods.
The high level of salt in processed food is a great public health concern; salt increases blood pressure, and thereby the risk of developing cardiovascular disease, the biggest killer worldwide.
According to the report, salt intake in India is estimated to be more than double the recommended maximum of 2000mg sodium (5gm salt) /day set by WHO. High salt intake increases the risk of developing high blood pressure, the main cause of strokes and a leading cause of heart attacks and heart failure – the most common causes of death and disability in the world. Excess salt consumption is estimated to cause about 600,000 deaths each year and to be the fifth leading cause of death in India.
Foods were categorised into 18 main groups
Alcoholic beverages; Bread and bakery products; Cereal and grain products; Confectionery; Convenience foods; Dairy and dairy alternatives; Edible oils and oil emulsions; Eggs; Fish and fish products; Fruits and vegetables; Meat and meat products; Non-alcoholic beverages; Sauces and spreads; Snack foods; Sugars, honey and related products; Special foods; Unable to be categorised; Vitamin and mineral supplements.
Of these 18 main food groups, Bread and bakery products, Cereal and grain products, Convenience foods, Dairy and dairy alternatives, Fish and fish products, Fruits and vegetables, Meat and meat products, Sauces and spreads and Snack foods were identified as likely significant contributors to salt in the Indian diet. These nine main food groups were then sub-categorised into specific food groups according to the food composition database criteria. For each food product, the brand name, product name, serving size, presence of nutritional information and sodium content per 100gm was recorded.
Further representative of George institute K Krishnaswamy stated that the main objective of the study was to study the levels of the salt in various food products and they found the levels higher than prescribed limit.
Meanwhile, according a representative of All India Food Processors’ Association, many a times salt is used for preservation of the food product and the salt intake in food also depends upon the food habit of the individual. Such food was termed until recently as junk food but now it was being called as food high on sugar, salt and fat. “Although everything including salt, sugar and fat are vital component of the food and the body requires them as well but the amount certainly needed care,” he stated.
P Rajan Mathews, VP, sales & marketing, food division, Desai Brothers Ltd, who are into pickle business revealed that the reason behind the excess salt is that salt acts as flavour potentiater in many of the food products. Excess salt in some of the foods acts as preservation (especially pickles) but the consumption pattern is along with staples - rice or chapati hence the required salt level decreases resulting in less intact of sodium overall.
Same applies to papads as it is an accompaniment along with meals which are consumed along with staples such as rice or chapati during meals but it does not come under the pickles category like excess salt. Palatable salt is added in papad and not excess.
“In FSSAI, this category is not included however BIS category do have but doesn’t mention the salt content %. This product is designed as per palatable requirement which is quite acceptable as an accompaniment with meals. Pickles as per FSSAI not less than 12% (pickle in brine).”
He added that they were exporting to various countries ( more than 40 countries ) and no such objectionable issue occurred. The major difference is in regards to nutrition panel in export market, which creates awareness on serve size and amount of sodium intake per serve.
Key Findings: Salt content in processed foods in India
Background
Salt intake in India is estimated to be more than double the recommended maximum of 2000mg sodium (5g salt) /day set by World Health Organisation. High salt intake increases the risk of developing high blood pressure, the main cause of strokes and a leading cause of heart attacks and heart failure – the most common causes of death and disability in the world.iExcess salt consumption is estimated to cause about 600,000 deathsiieach year and to be the 5th leading cause of death in India.
Traditionally the main source of salt in Indian diets is that added during cooking or at the table and from pickled vegetables. However recent years have seen a shift in the dietary habits of many Indians from traditional home cooking towards convenience foods. This is particularly so in urban areas where processed foods are increasingly available.iii
The aim of this report is to identify the number of products which have information about salt on the nutrition information panel on the package label; to compare the salt content of processed food products sold in India and to benchmark the salt content of Indian products against corresponding salt targets set to be achieved in the United Kingdom by 2017.iv
Methods
Data collection
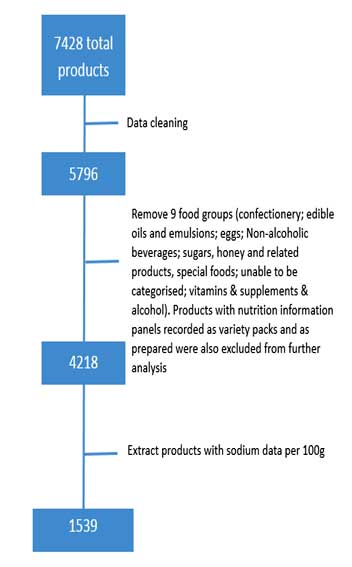
Nutrition data from the FoodSwitch database of packaged food products collected from eight branches of supermarket chains in Delhi and Hyderabad, Andhra Pradesh between 2012 and 2014was used for this report. Data was reviewed and cleaned to remove duplicate products, multipacks, and to correct data inputting errors (Figure 1).
Data categorisation
Foods were categorised into 18 main groupsv:
-
Alcoholic beverages
-
Bread and bakery products
-
Cereal and grain products
-
Confectionary
-
Convenience foods
-
Dairy and dairy alternatives
-
Edible oils and oil emulsions
-
Eggs
-
Fish and fish products
-
Fruits and vegetables
-
Meat and meat products
-
Non-alcoholic beverages
-
Sauces and spreads
-
Snack foods
-
Sugars, honey and related products
-
Special foods
-
Unable to be categorized
-
Vitamin and mineral supplements
Of these 18 main food groups, 9 (in bold) were identified as
likely significant contributors to salt in the Indian diet.iiThe
9 main food groups were then sub-categorised into specific food
groups according to the food composition database criteria5.For
each food product, the brand name, product name, serving size,
presence of nutritional information and sodium content per 100g was
recorded.
Data analysis
The proportion of products with nutrition information and the
proportion of products displaying sodium information was calculated
overall for each main food group, and each specific food category. In
addition, for products with sodium data reported mean levels and
ranges of sodium (mg/100g) were calculated for each main food group
and specific food category.
Levels of salt in specific food categories were compared against the
UK 2017 salt targets which provide salt targets for 76 categories of
food. The proportions of Indian products known to meet the UK 2017
salt targets (i.e. reporting salt content data and having a salt
content less than the target) were derived for each specific food
category.
Results
There were5796 products in the 18 main food groups. Seventy-six
percent of these products had a nutrition information panel (NIP),
and thirty-five percent had information about the salt content
reported as sodium per 100g (Table 1). Note
- Salt in foods is usually reported as sodium. To convert the sodium
content to the salt content it is necessary to multiply by 2.5 –for
example 100mg/100g sodium = 250mg/100g salt.
There were 4218 products in the 9 main food groups identified as
major contributors to sodium in the diet. 1539 (27%) of these
products had information about salt content reported on the label
(Table 2).
Mean sodium content
There was a wide range of sodium content both between and within the
9 main food groups studied. The food group with the highest mean
sodium content was sauces and spreads,2213mg/100g(range 0.0 to 21218
mg/100g)compared to the lowest mean sodium content found in meat and
meat products 413mg/100g, (range 2.0-1000 mg/100g).
Within sauces and spreads the highest mean sodium content were found
in: meal based sauces 5601mg/100g (range 179–21218mg/100g); pickles
4487mg/100g, (range 1600-5433) and Asian sauces 3190mg/100g (range
270-8400)
Products meeting UK 2017 salt targets
Overall 21% of products were known to meet the UK 2017 sodium targets
with greatest compliance among hard cheeses (60%), pasta (56%), and
canned soup (47%). Only 2 bread products were known to meet the
target (Table 2).
Key findings
-
A quarter (24%) of products do not have any nutrition information,
and therefore do not meet the Food Safety and Standards Authority of
India (FSSAI) national nutrition labelling requirements for
processed foods (2011). The FSSAI standard requires all processed
food products to include information about energy, protein,
carbohydrate and fat on nutrition information panels on pack.iii
-
Two thirds of products do not list salt on the nutrition information
panel and do not meet International Codex Alimentarius requirements
–an international food standard, requiring all food products to
list sodium information.iv
FSSAI does not currently require reporting of sodium content on
pack.
-
Some products contain excessively high levels of salt; for example
papads, a commonly consumed meal accompaniment in India have a mean
sodium content of 1219mg/100g – with a range of 2-4000mg/100g.
This illustrates that papads can be made with as little as 2mg of
sodium/100g, 2000 times less sodium than the papad product with the
highest sodium content.
-
Less than a quarter of products meet the UK 2017 salt target,
emphasising the need for a clear strategy to reduce the amount of
salt added to processed foods.
Implications
-
Incomplete nutrition information makes it impossible for people to
know what they are eating and hard to make a healthier choice.
-
Absent nutrition information makes it difficult to monitor amounts
of salt, fat and sugar in widely consumed food products, and hold
the food industry to account to reduce the unnecessary amounts of
salt, fat and sugar added to processed foods.
-
The high level of salt in processed food is a great public health
concern; salt increases blood pressure, and thereby the risk of
developing cardiovascular disease, the biggest killer worldwide.
Specific examples below to be used in media statement – once
products are checked in store:
Papads are a commonly consumed meal accompaniment in India, and so
are eaten as part of a meal, and often with every meal. The excessive
amount of salt in some papads may contribute huge amounts of salt to
the diet of some Indians. The variation in salt content between one
papad product and another demonstrates that such high levels of salt
are not required in the manufacturing of papads, and there is likely
huge potential for reformulation of these products to much lower salt
levels.
-
A 60g serving of ‘Knorr Soupy Noodles Yummy
Chicken’ (2486 sodium/100g) would contribute almost 3 quarters of
a days’ worthv
of salt in a single dish (3.7g salt). By comparison, a similar
product ‘Koka Noodles Spicy Shrimp Flavour noodles’ with a much
lower salt content (281 sodium/100g) would contribute just 0.7salt
per serving (14% of recommended daily intake).
This illustrates that products can be made
with far less salt, and food companies should work to reduce the
amount of sodium added to processed foods to their lowest possible
level, gradually so that consumers don’t notice the difference.
This illustrates that Kelloggs is able to make the same product
with far less salt, and should do so across all markets in which it
sells its products to ensure that everyone can enjoy the benefit of
eating less salt (sugar, and fat).
Table 1 shows the proportionsof food products carrying nutrition Information and the proportion of products carrying information about salt levels
| Main food group | No. of products | Products with
nutrition information | Products with salt data
(sodium
per 100g) | | | | No | % | No. | % | | Bread and bakery products | 600 | 558 | 93.0% | 164 | 27.3% | | Cereal and grain products | 771 | 514 | 66.7% | 260 | 33.7% | | Confectionery | 346 | 277 | 80.1% | 111 | 32.1% | | Convenience foods | 174 | 174 | 100.0% | 117 | 67.2% | | Dairy and dairy alternatives | 289 | 284 | 98.3% | 131 | 45.3% | | Edible oils and oil emulsions | 142 | 134 | 94.4% | 39 | 27.5% | | Eggs | 7 | 5 | 71.4% | 1 | 14.3% | | Fish and fish products | 46 | 45 | 97.8% | 32 | 69.6% | | Fruit and vegetables | 1219 | 546 | 44.8% | 339 | 27.8% | | Meat and meat products | 61 | 47 | 77.0% | 12 | 19.7% | | Non-alcoholic beverages | 659 | 549 | 83.3% | 184 | 27.9% | | Sauces and spreads | 572 | 532 | 93.0% | 281 | 49.1% | | Snack foods | 504 | 452 | 89.7% | 203 | 40.3% | | Sugars, honey and related products | 145 | 85 | 58.6% | 35 | 24.1% | | Special foods | 158 | 158 | 100.0% | 74 | 46.8% | | Unable to be categorised | 15 | 9 | 60.0% | 5 | 33.3% | | Vitamin and mineral supplements | 82 | 32 | 39.0% | 11 | 13.4% | | Alcohol | 6 | 2 | 33.3% | 1 | 16.7% | | Total | 5796 | 4403 | 76.0% | 2000 | 34.5% |
Table 4 shows the mean and range of sodium for specific food categories within the 9 main foods groups, and the percentage of products meeting the UK 2017 salt targets | Table 4. Mean, range of sodium and percentage of products known to meet the UK 2017 sodium target | | Specific food group | No. of products | Products with
sodium data | Mean
(mg/100g) | Range | UK 2017
target | % Products known
to meet the
UK2017 target | | % | (mg/100g) | | Bread and bakery products | 597 | 27% | 473 | 2.0-4000.0 | | | | Biscuits, plain dry | 41 | 20% | 460 | 300-670 | 380 | 10% | | Biscuits, savoury | 44 | 5% | 736 | 708-764 | 700 | 0% | | Biscuits, sweet filled | 168 | 26% | 214 | 14-472 | 380 | 21% | | Biscuits, sweet unfilled | 139 | 40% | 254 | 6-701 | 380 | 31% | | Bread | 32 | 19% | 1116 | 2.0-4000 | 450 | 6% | | Papad (other bread) | 120 | 28% | 1219 | 2.0-4000 | 1000 | 16% | | Cake mixes | 13 | 8% | 909 | - | 180 | | | Cakes | 40 | 35% | 244 | 40-1600 | 280 | 30% | | Cereal and grain products | 766 | 34% | 474 | 0.0-7250 | | | | Breakfast cereals | 213 | 62% | 478 | 0-2110 | 400 | 33% | | Cereal and nut based bars | 18 | 28% | 33 | 0-75.1 | 380 | 28% | | Couscous | 1 | 100% | 100 | | 70 | 0% | | Plain Noodles | 12 | 42% | 292 | 21-600 | 350 | 25% | | Instant Noodles | 87 | 43% | 1245 | 26-7250 | 350 | 13% | | Pasta | 74 | 58% | 52 | 0-1000 | 350 | 57% | | Rice | 119 | 20% | 6 | 0-38 | 70 | 20% | | Flavoured Rice | 16 | 0% | | | | | | Plain cereal based products | 226 | 5% | 799 | 4-2970 | 400 | 4% | | Convenience foods | 167 | 71% | 1337 | 0.0-5378 | | | | Ready meals | 85 | 66% | 503 | 0-1400 | 380 | 18% | | Canned soup | 15 | 87% | 275 | 200-501 | 250 | 47% | | Dry soup | 66 | 74% | 2573 | 180-5378 | 250 | 15% | | Salad | 1 | | | | | | | Dairy and dairy alternatives | 289 | 45% | 502 | 0.0-2000 | | | | Cheese, hard | 15 | 93% | 716 | 152.1-1095 | 800 | 60% | | Cheese, soft | 9 | 67% | 900 | 456.6-1520 | 270 | 0% | | Cheese, processed | 31 | 87% | 1260 | 840-1730 | 720 | 0% | | Paneer | 6 | 50% | 181 | 50-400 | 270 | 33% | | Cream | 3 | 67% | 324 | 34-614 | | 0% | | Desserts | 65 | 57% | 342 | 0-2000 | 110 | 26% | | Ice cream | 65 | 20% | 68 | 43-180 | | | | Milk | 71 | 34% | 60 | 0-320 | | | | Yogurt | 24 | 25% | 35 | 28-40 | | | | Fish and fish products | 46 | 70% | 457 | 38.0-887 | | | | Canned fish | 16 | 88% | 421 | 48-870 | 360 | 31% | | Other canned fish | 2 | 100% | 710 | 550-870 | 600 | 50% | | Frozen fish | 28 | 57% | 457 | 38-887 | 300 | 18% | | Fruit and vegetables | 1218 | 28% | 764 | 0.0-8000 | | | | Fruit | 108 | 41% | 43 | 0-539 | | | | Herbs and spices | 555 | 20% | 1433 | 0-8000 | | | | Jams and marmalades | 85 | 48% | 35 | 0-387 | 250 | 47% | | Nuts and seeds | 142 | 34% | 318 | 10-1100 | | | | Vegetables | 179 | 0% | | | | | | Canned Vegetables | 44 | 89% | 112 | 0-384 | 50 | 52% | | Uncanned Vegetables | 5 | 0% | | | | | | Dried Vegetables | 11 | 27% | 281 | 23-446 | | | | Plain frozen vegetables | 4 | 25% | 70 | | 275 | 25% | | Pickled vegetables | 57 | 75% | 1719 | 1-8000 | 1500 | 37% | | Fresh packaged Fruit and Vegetables | 28 | 36% | 355 | 10-1407 | | | | Meat and meat products | 61 | 20% | 413 | 2.0-1000 | | | | Meat alternatives | 24 | 8% | 51 | 36-65 | 750 | 8% | | Canned meat | 5 | 0% | - | - | 300 | | | Frozen meat | 18 | 22% | 367 | 100-504 | 300 | 6% | | Salami and cured meats | 2 | 0% | - | - | 650 | | | Sausages and hotdogs | 6 | 17% | 410 | - | 550 | 17% | | Plate and meat spreads | 1 | 100% | 1900 | - | 550 | 0% | | Other meat products | 5 | 80% | 746 | 614-1000 | 300 | 0% | | Sauces and spreads | 572 | 49% | 2213 | 0.0-21218 | | | | Asian sauces | 44 | 55% | 3190 | 270-8400 | 1500 | 16% | | Gravies and stocks | 10 | 10% | 0 | | 450 | 10% | | Marinades | 7 | 57% | 3408 | 2037-4559 | 1500 | 0% | | Meal-based sauces | 137 | 40% | 5602 | 179-21218 | 1500 | 6% | | Cranberry sauce | 2 | 50% | 0 | | 480 | 0% | | Mustard sauces | 9 | 33% | 1580 | 2020-2600 | 480 | 0% | | Other sauces | 13 | 69% | 451 | 350-940 | 480 | 46% | | Pesto | 3 | 33% | 470 | - | 650 | 0% | | Pasta sauces | 56 | 82% | 419 | 256-850 | 370 | 27% | | Table sauces | 62 | 56% | 1061 | 0.7-2400 | 680 | 10% | | Tomato paste | 8 | 63% | 1143 | 184-2030 | 680 | 25% | | Mayonnaise | 18 | 50% | 631 | 18-1500 | 500 | 22% | | Salad dressings | 26 | 88% | 759 | 1.0-2100 | 600 | 23% | | Vinegar | 16 | 38% | 123 | 0-720 | 1000 | 38% | | Spreads | 55 | 56% | 540 | 156-1700 | 550 | 35% | | Relishes | 3 | 67% | 645 | 440-850 | 1500 | 67% | | Pickles | 96 | 25% | 4488 | 1600-5433 | 1500 | 0% | | Chutneys | 7 | 29% | 1284 | 301-2266 | 480 | 14% | | Snack foods | 502 | 40% | 665 | 0.0-2300 | | | | Corn chips | 26 | 50% | 786 | 58-1464 | 800 | 23% | | Extruded snacks | 60 | 15% | 491 | 106-1179 | 800 | 13% | | Indian snack foods | 288 | 38% | 586 | 0-2000 | 1000 | 33% | | Popcorn | 31 | 84% | 837 | 200-1500 | 800 | 39% | | Potato crisps | 64 | 39% | 691 | 359-1090 | 580 | 14% | | Snack packs | 33 | 67% | 818 | 40-2300 | 800 | 36% | | Totals | 4218 | 36% | | | | 16% | Table 3: Comparable products with highest and lowest salt content Table 3. Examples of lowest and highest sodium
products of some of the key food categories | | Food category | Lowest levels
sodium products | Highest levels
sodium products | | Brand Name | Product Name | Sodium (mg / 100g) | Brand Name | Product Name | Sodium
(mg / 100g) | | Bread and bakery products | | Biscuits, plain dry | Mc Vitie's | Mc Vitie's Marie | 300 | Kraft | Kraft Ritz Crackers Krekers | 670 | | Biscuits, sweet filled | Karachi Bakery | Karachi Bakery Chand Biscuits | 14 | Cadbury | Cadbury Oreo Choco Creme | 472 | | Biscuits, sweet unfilled | Karachi Bakery | Karachi's Bakery Pure Vegetarian Fruit Biscuits | 6 | Tiffany | Tiffany Digestive Light Natural Wheat Biscuits | 701 | | Other bread - Papad | Arul | Arul Appalam | 2 | 777 | Sri Ganeshram's 777 Brand Appalam | 4000 | | White bread | Modern Family | Modern Family Shakti White Sandwich Bread | 440 | Harvest | Harvest Gold White Bread | 497 | | Cakes | Cogon | Cogon Tropical Fruit Flavoured Pudding | 40 | Cakees | Cakees Plum Cake Extra Rich | 1600 | | Cereal and grain products | | Breakfast cereals | Bambino | Bambino Roasted Vermicelli | 0 | Gits | Gits Rava Dosai Mix | 2110 | | Ready to eat breakfast cereal | Waitrose | Waitrose Seriously Nutty Maple & Mixed Nut Crisp | 10 | Kellogg’s | Kellogg's Corn Flakes With Real Almond & Honey | 650 | | Cereal and nut based bars | Heartland | Heartland Organic Oatsli Orange & Coconut Cereal Bar | 0 | Natural's | Natural's Almond Treat Energy Bar | 75 | | Plain Noodles | Dragon | Dragon Super Special Quality Instant Noodle Pack | 21 | Blue Dragon | Blue Dragon Express Instant Noodles | 600 | | Instant Noodles | Koka | Koka Noodles Spicy Shrimp Flavour | 281 | Knorr | Knorr Soupy Noodles Yummy Chicken | 2486 | | Filled/flavoured pasta | Essential Waitrose | Essential Waitrose Short Cut Spaghetti In Tomato Sauce | 170 | Gowardhan | Gowardhan Go Natural Cheese Shredded Italian Pasta | 1000 | | Rice | Waitrose | Waitrose A Handful Of Sushi Rice | 0 | Lal Qilla | Lal Qilla The Original Basmati Rice Traditional Special Old Malai | 38 | | Convenience foods | | Ready meals | MTR | MTR Kesar Suji Halwa Kesar Bhath Tasty Delights Ready To Eat | 0 | Maiyas | Maiyas Kharabath Instant mix | 1400 | | Canned Soup | Heinz | Heinz Cream of Tomato Soup With A Twist of Chilli | 200 | Sil | Sil Tomato Soup La Tomatina | 501 | | Soup | Batchelors | Batchelors Slim A Soup Golden Vegetable | 180 | Knorr | Knorr Chinese Hot & Sour Veg Soup | 5378 | | Dairy and dairy alternatives | | Cheese, hard | Go | Go Cheese Wedges Soft & Creamy | 152 | Dodoni | Dodoni Feta | 1095 | | Cheese, soft | Lemnos | Lemnos Sweet Chilli Cream Cheese | 457 | Milky Mist | Milky Mist Premium Cheese Spread Garlic | 1520 | | Cheese, processed | Amul | Amul Cheese Spread Punchy Pepper | 840 | Britannia | Britannia Slimz Cheesy Slices | 1730 | | Paneer | Milky Mist | Milky Mist Paneer | 50 | Gowardhan | Gowardhan Fresh Paneer Classic Block | 400 | | Cream | Amul | Amul Fresh Cream | 34 | Blue Bird | Blue Bird Whipped Cream Instant Topping | 614 | | Desserts | MTR | MTR Rasogolla Tasty Delights Sweets | 0 | Nestle | Nestle Milkmaid Creations Badaam Kheer Mix | 2000 | | Ice cream | Kwality Walls | Kwality Wall's Fruit N Nut | 43 | Mother Dairy | Mother Dairy Kulfi | 180 | | Milk | Blue Dragon | Blue Dragon Coconut Milk Light | 0 | Waitrose | Waitrose Love Life Milk Chocolate Drink | 320 | | Fish and fish alternatives | | Canned fish | Oceans Secret | Oceans Secret Tuna Chunks In Sunflower Oil | 48 | Costa's | Costa's Sardines In Tomato | 870 | | Other canned fish | John West | John West Smoked Oysters In Barbecue Sauce | 550 | Ayum Brand | Ayam Brand Mackerel Steaks Fried With Sweet Chilli | 870 | | Frozen fish | Oceanaa | Oceanaa Squid Rings Breaded | 38 | Sumera | Sumeru Five Senses Large Prawns | 887 | | Fruit and vegetables | | Herbs and spices | Colman's | Colman's Mustard Powder | 0 | unknown | Tify Exotic Barbeque Seasoning | 8000 | | Jams and marmalades | Stute | Stute Diabetic Morello Cherry Extra Jam With Sweetener | 0 | Fruitoman's | Fruitoman's Mixed Fruit | 387 | | Nuts and seeds | Dcc Delicious | Dcc Delicious Cashews Dry Roasted Cream Onion | 10 | Wonderful | Wonderful Pistachios Salt & Pepper | 1100 | | Canned Vegetables | Epicure | Epicure Organic Bean Cuisine | 0 | American Garden | American Garden Baked Beans In Tomato Sauce | 384 | | Fresh packaged Fruit and Vegetables | Essential Waitrose | Essential Waitrose Small Potatoes In Water | 10 | Golden Brown | Golden Crown Button Mushroom | 1407 | | Fruit and vegetables | | Meat alternatives | Mori-Nu Silken | Mori - Nu Silken Tofu Great For Entr'ees & Desserts | 36 | Mori-Nu Silken | Mori - Nu Silken Tofu Extra Firm For Grilling Stir Fry &Sautéing | 65 | | Frozen meat | Al Kabeer | Al Kabeer 6 Seekh Kabab Chicken | 100 | Cambay Tiger | Cambay Tiger Prawn Boomerang | 504 | | Other meat products | Keya | Keya Simply Fantastic Chicken Kofta | 614 | Sumera | Sumeru Farm Fresh Back Bacon | 1000 | | Sauces and spreads | | Asian sauces | Blue Dragon | Blue Dragon Szechuan Pepper Shot Bursting With Flavour | 270 | Pantai | Pantai Light Soy Sauce | 8400 | | Marinades | Kikkoman | Kikkoman Teriyaki Marinade Thick | 2037 | Kikkoman | Kikkoman Teriyaki Marinade With Roasted Garlic | 4559 | | Meal-based sauces | Ching's | Ching's Secret Manchurian Miracle Masala | 179 | Ustad Banne Nawab’s | Ustad Banne Nawab's Ethnic Hyderabadi Vegetable Biryani Masala | 21218 | | Mustard sauces | Essential Waitrose | Essential Waitrose English Mustard | 2020 | Remia | Remia Moutarde De Dijon | 6600 | | Other sauces | Prego | Prego Tomato Basil Garlic Italian Sauce | 350 | Essential Waitrose | Essential Waitrose Tartare Sauce | 940 | | Pasta sauces | Ragu | Ragu' Light Tomato & Basil Pasta Sauce | 256 | Barilla | Barilla Olive | 850 | | Table sauces | Heinz | Heinz Tomato Ketchup | 700 | American Garden | American Garden Premium Hot Sauce | 2400 | | Tomato paste | Ayum Brand | Ayam Brand Tomato Puree | 184 | Waitrose | Waitrose Sundried Tomato Paste In Olive Oil | 2030 | | Mayonnaise | Sil | Sil Orange Marmalade Wakee Orange | 18 | Alfa | Alfa Mayonnaise | 1500 | | Salad dressings | Remia | Remia Thousand Island Salad Dressing | 1 | Colman's | Colman's Fresh Garden Mint Concentrate | 2100 | | Spreads | Skippy Natural | Skippy Natural Creamy Peanut Butter Spread | 156.2 | Blue Dragon | Blue Dragon Sweet Chilli Dipping Sauce Original | 1700 | | Relishes | Waitrose | Waitrose Kalamata Olive & Sun - Dried Tomato Tapenade | 440 | Waitrose | Waitrose Green Olive, Coriander & Lemon Tapenade | 850 | | Pickles | Unknown | Beevi's Prawn Pickle | 1600 | Sanjeev's Kapoor Khazana | Sanjeev Kapoor's Khazana Hot Mango Pickle | 5433 | | Chutneys | Smith & Jones | Smith & Jones Bhelpuri Chutney | 301 | Ching's | Ching's Secret Schezwan Chutney | 2266.6 | | Snack foods | | Corn chips | Haldiram's | Haldiram's Nagpur Corn Flakes Mixture Indian Snacks Casse - Croute Indiens | 58 | Italo's | Italo's Four Cheeses Flavor Baked Corn Chips | 1464 | | Extruded snacks | Win2 | Win2 Magic Crunch Corn Snack With Strawberry Filling | 106 | Munch King | Munch King Cheese Curls | 1178 | | Indian snack foods | Charlie’s | Charlie’s Mora Sev | 0 | Jabsons | Jabsons Khakhra Roasted Wheat Crisps | 2000 | | Popcorn | Popitas | Popitas Salty Sensation Instant Popcorn | 200 | Act II | Act II Golden Sizzle Instant Popcorn | 1500 | | Potato crisps | Haldiram's | Haldiram's Halke Fulke Salted Potato Chips | 359 | Lorenz | Lorenz Naturals Mild Paprika | 1090 | | Snack packs | Charlie’s | Charlie’s Butter Chakli | 40 | Garden | Garden Mix Farsan | 2300 |
Figure 1: Data analysis
References
1. Global Burden of Disease 2013.Available from:http://vizhub.healthdata.org/gbd-compare/
2. World Health Organization, Reducing salt intake in populations: report of a WHO forum and technical meeting, 5-7 October 2006, Paris, France. 2007.
3. Kennedy, G., G. Nantel, and P. Shetty. "The double burden of malnutrition: case studies from six developing countries." Rome: Nutrition Planning, Assessment and Evaluation Service, Food and Agriculture Organization of the United Nations (2006).
4. Department of Health: Salt Reduction 2017. United Kingdom, 2014. Available from:https://responsibilitydeal.dh.gov.uk/pledges/pledge/?pl=49
5. Dunford E, Webster J, Blanco-Metzler A, Czernichow S, Ni Mhurchu C, Wolmarans P et al. International collaborative project to compare and monitor the nutritional composition of processed foods. European journal of preventive cardiology. 2012;19(6):1326-1332.
6. Dietary Guidelines for Indians- A Manual. Available from: http://ninindia.org/dietaryguidelinesforninwebsite.pdf
7. Food Safety and Standards Authority of India. Food Safety and Standards (Packaging and Labelling) Regulations. 2011; Available from: http://www.fssai.gov.in/Portals/0/Pdf/Food%20Safety%20and%20standards%20 (Packaging%20and%20Labelling) %20regulation,%202011.pdf.
8. Codex Alimentarius. Guidelines on Nutrition Labelling. 2011;Available from: http://www.fao.org/docrep/005/y2770e/y2770e06.htm.
9. WHO. Guideline: Sodium intake for adults and children. Geneva, World Health Organization (WHO), 2012.
10. Kelloggs Crunchy Nut Cornflakes accessed online 20th May 2016. Available from: http://www.waitrose.com/shop/DisplayProductFlyout?productId=33
|
|
|
|
|
|
|
|
|
|